The objective of this lab is to use different skills of extracting land surface temperature. This was done in three main ways 1) visual identification of variabity in relative surface temperature through surface reflectance using spectral emittance from sensors, 2) qualitatively estimate land surface temperature from thermal bands, 3) building of simple and complex models to extract land surface temperatures from satellite images.
Methods
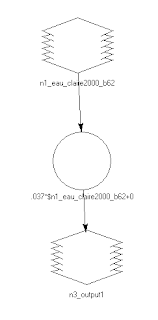
The lab was divided into four parts using Erdas Imagine and ArcMap. The steps were completed as follows, 1) indentify relative variations in land surface temperature, 2) calculate land surface temperature from ETM+ satellite images, 3) calculate surface temperatures from TM images, and 4) calculate land surface temperatures from Landsat 8 images. To begin the lab we were asked to identify areas of relative warm and cooler temperatures from satellite images taken from Landsat ETM+ . After identifying areas of relative temperatures were then asked to calculate land surface temperature from ETM+ images. This began by converting Digital Numbers (DN) to at-satellite radiance using the formula below (Figure 1.) that was incorporated in a model (Figure 2.). Once DN were converted into satellite radiance the new satellite radiance values were then converted into radiant surface temperature using a formula (Figure 3.) and a simple model (Figure 4.).
 |
| Figure 1. Formala used to covert DN to at-satellite radiance. |
- Grescale: amount of gain
- Brescale: bias in the image
 |
| Figure 2. Model used to calculate land surface temperature from ETM+ images incorporating the formula in Figure 1. |
 |
| Figure 3. Formula used to convert at-satellite radiance to surface temperature. |
- TB: at-satellite temperature in degrees kelvin
- Lλ: spectral radiance
- K1, K2: pre-launch constraints
 |
| Figure 4. Simple model used to convert at-satellite radiance to surface temperature. |
Following the calculating land surface temperatures from ETM+, Land surface temperatures were then calculated for a TM using a similar methodology only this time instead of using a simple model a single more complex model was created (Figure 5.).
 |
| Figure 5. Model used to create TM land surface temperatures. |
The final task was to calculate land surface temperatures using Landsat 8 imagery using processes described above for the TM image
Results1) Identification of relative land surface temperature
 |
| Figure 7. Surface temperature calculated of ETM+ image in Erdas Imagine and then displayed in ArcMap. Areas in red display areas of relativily high temperature. |
3) Calculated land surface temperature from TM images
 |
| Figure 7. Surface temperature calculated of a TM image in Erdas Imagine and displayed in ArcMap. Areas of dark red indicated areas of relitivly high temperatures |
 |
| Figure 8. Calculated surface temperature for a Landsat 8 image for Eau Claire and Chippewa County created in Erdas Imagine and displayed in ArcMap. |
Landsat satellite image is from Earth Resources Observation and Science Center, United States Geological Survey. Area of interest (AOI) file is derived from ESRI counties vector features.


No comments:
Post a Comment