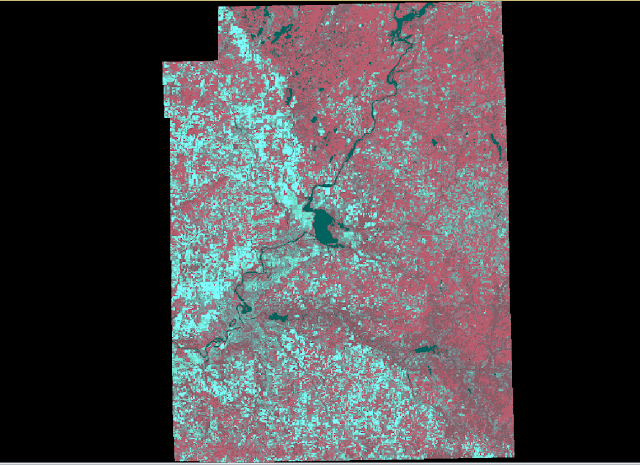
The purpose of this lab is extract biophysical and urban information from remotely sensed images using an unsupervised classification system. Once the images were clustered by the classifier, the images were then reclassified into different land cover types using a thematic classification scheme. The scheme consisted of five different land cover types which were water, agriculture, bare soil, forests and urban.
Methods
Part 1
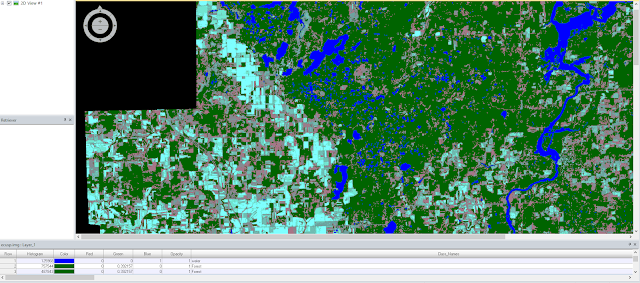
For this lab the ISODATA classification algorithm was used to classify an image that covered Eau Claire and Chippewa Counties. To begin the satellite image was brought into ERDAS Imagine. Once the image was brought in, the unsupervised classification tool (fig. 1) was used to create a new clustered image. The clustered image was divided in 10 separate clusters based upon similar spectral characteristics. The next step of this was to identify and label each of cluster by its land cover type. These land cover types were water, forest, agriculture, urban, and bare soil. This was done by opening the classified image's attribute table (fig. 3). The clusters were classified into 5 land cover types with each type having a different color, water (blue), urban (red), agriculture (pink), forest (green), and bare soil (brown).
 |
| Figure 1. Displays the settings used to create the classified image. |
 |
| Figure 2.The classified image divided into 10 separate clusters |
 |
| Figure 3. Areas in green have been reclassified into forest land cover |
Part 2
The next section of this lab was to run the same classification algorithm, only this time, increase the number of clusters and compare the final results. To do this the unsupervised classification tool was used again (fig. 4). The number of clusters were changed from 10 to 20.
 |
| Figure 4. Displays the settings used to create the classified image. |
Results
Part 1
Below (fig.5) is the final product after the 10 image clusters were reclassified into in their respective land cover types. The final product did leave a lot to be desired. Because only 10 clusters were created there were many different areas that had different land cover types but were included into the same classification. This made classifying the different classes difficult as they all included different areas that were not part of the land cover type that was reclassified. This can be seen in the image below where red areas are to represent urban areas. While the cities of Eau Claire and Chippewa were classified as mainly urban, there were many areas that were bare soil included in the urban land cover class. This is most evident in the eastern section of the image.
 |
| Figure 5. The reclassified image from part 1. The different land cover types are displayed in different colors, red (urban), green (forest), pink (agriculture), blue (water), and brown (bare soil). |
The results for part 2 were similar to that of part 1. The difference between the two was that part 2 produced an image that was more accurate. Because the number of clusters were increased from 10 to 20, the clusters were more accurate. This is because the increased number of clusters allowed for more diversity amongst the different spectral signitures. This was most evident in the agriculture class as not all crops have the same spectral characteristics. In part 1 many agricultural areas were classified into forest as the crops had similar characteristics of the trees. With the increased number of classifications these crops were able to be filtered out of those classes in part 2. Below is a map created in ArcMap using the reclassified image created in part 2 (fig. 6).
 |
| Figure 6. Map created displaying the reclassified image after the 20 clusters were reclassified into their land cover type. |
Sources
Images for this lab were provided by Dr. Cyril Wilson.
Images for this lab were provided by Dr. Cyril Wilson.


No comments:
Post a Comment