In the previous two labs a supervised classification and unsupervised classification images were created. The objective of this lab was complete an accuracy assessment of the previously created images using ground referencing testing samples.
Methods
To begin the lab ground reference testing samples needed to generated in a reference image. This was done in ErdasImagine by having two views open, one with the classified image and the other with the reference image. Then using the accuracy assessment tool, 125 random points (reference points) were distributed throughout the reference image using a stratified random distribution (fig. 1).
 |
| Random points generated within the reference image for the unsupervised classified image. |
 |
| Figure 2. Classification values used to assign the land cover values for each of the random points |
 |
| Figure 3. A portion of the list of assigned values for the random points for the unsupervised classified image. |
 |
| Figure 4. Accuracy assessment created for one of the images. |
 |
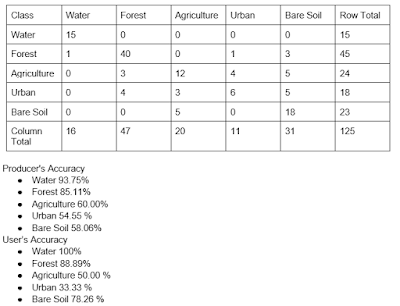
| Figure 5a. Error matrix table created for the unsupervised classification image displaying both the user and producer accuracy for each land cover type. |
 |
| Figure 5b. Error Matrix Table created for the supervised classified image. |
The overall accuracy for the supervised classification was 64% and the unsupervised classification was 72.8%. A potential reason for the unsupervised classification producing better results than the supervised classification may be that the training samples generated to create the supervised image did not accurately account for the variability among the spectral signatures for each class. This is especially true for the urban and bare soil classes. Both classification methods were accurate for the water and forest classes. This is because these areas have a relatively low amount of variability in their spectral characteristics. Both classifications had poor accuracy for the bare soil and urban classes. This is because these areas have similar spectral characteristics and the urban class has a very wide variety of spectral signatures within the class.
Sources
Images for this lab were provided by Dr. Cyril Wilson


No comments:
Post a Comment